London to Brighton speed
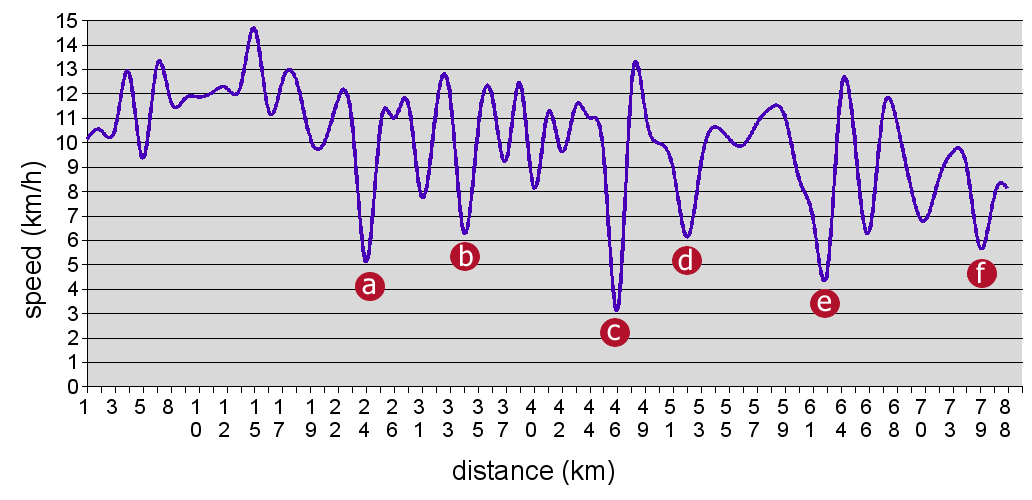
This is the speed graph of my run
from London to Brighton. Speed was integrated on 500m sections.
Slow motion zones can be explained by the following:
- a: first stop at the beginning of Farthing Downs
- b: water stop at Redhill
- c: short rest after Horley
- d: cramps and moment of doubt at the exit of
Crawley
- e: water stop at Cuckfield
- f: ascent of Dictchling Beacon
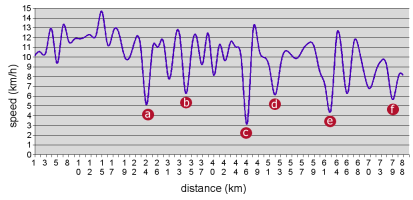
click for larger image
It's interesting to distinguish between 3 main parts: the first
third (start to
a) virtually always over 10km/h, the second
third (
a to
d) at the constant average speed but with
lots of slower parts and the last one (
d to the end) slowing
down constantly.